Every listing site shows you granite countertops. We show you the drawdown schedule, the dock authority, the clarity, and what the first year actually costs.
Clarity, drawdown, dam operator, dock authority, species, and regulations for every lake.
Docks, septic, flood, seawall, winterization. The numbers listing sites never show.
Tell us budget, drive time, and priorities. We rank the lakes that actually fit.
STR revenue, cap rate, cash-on-cash, and IRR — with regulation risk built in.
Most people fall in love with a listing and learn about the water afterwards. We flip the order, because the water is the part you cannot renovate.
A reservoir can drop forty feet in autumn. A dock may need federal approval that never comes. A lake can prohibit the rental income you underwrote. None of that is in the photos.
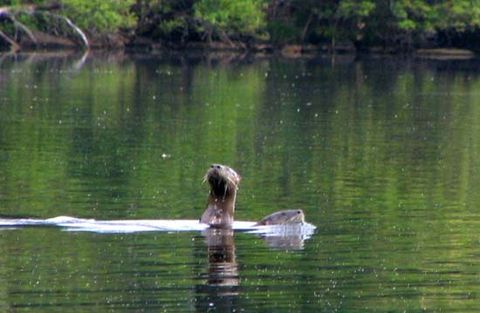
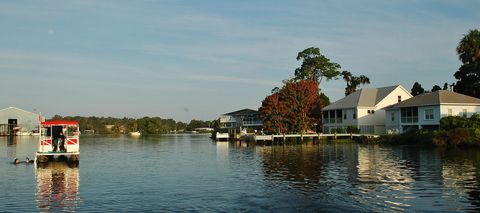
WaterArchives.org · CC BY-SA 2.0 · Wikimedia Commons
Docks, septic, flood, seawall — everything the mortgage calculator misses.
Nightly rate, occupancy, seasonality, management, and lodging tax to net.
Ten financing paths matched to your file, plus eight grant programs.
The waterfront metric nobody publishes.
Beyond the mortgage: septic, wells, seawall reserve, winterization, and the flood premium.
A reservoir that looks perfect in June can be a mudflat in December. Here is how to check.
A dock is not a given. Who approves one, how long it takes, and the questions to ask before you write an offer.
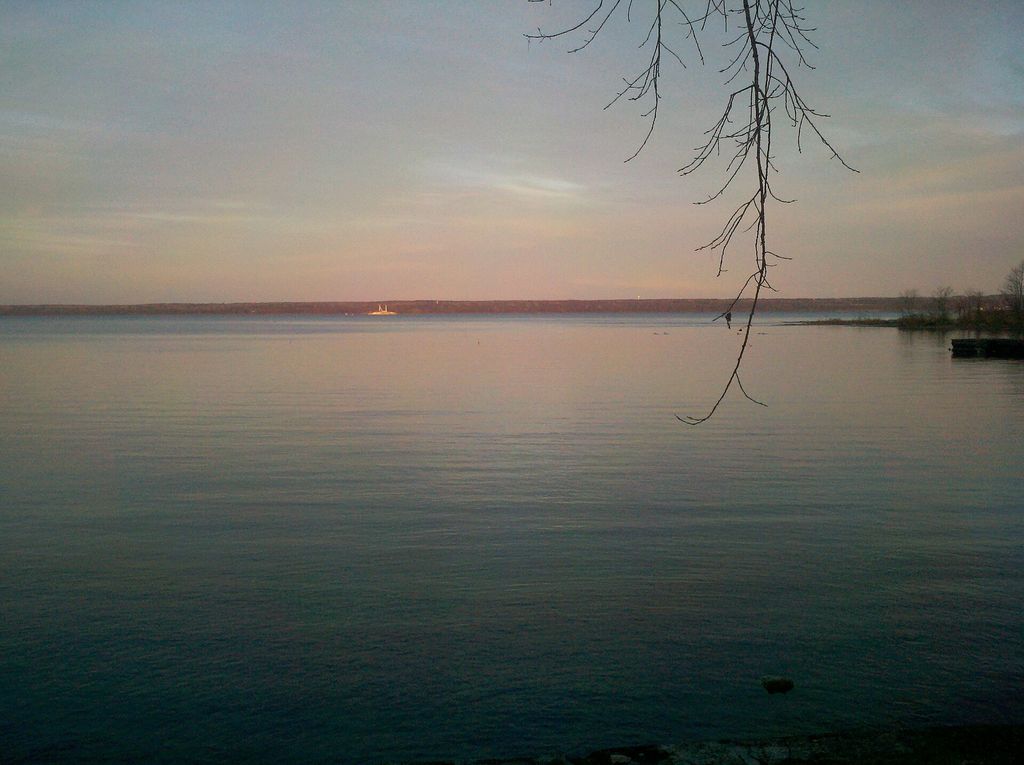
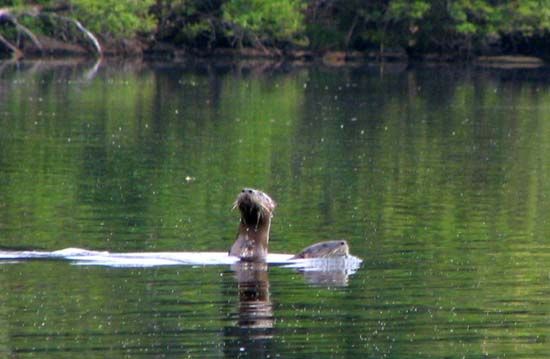
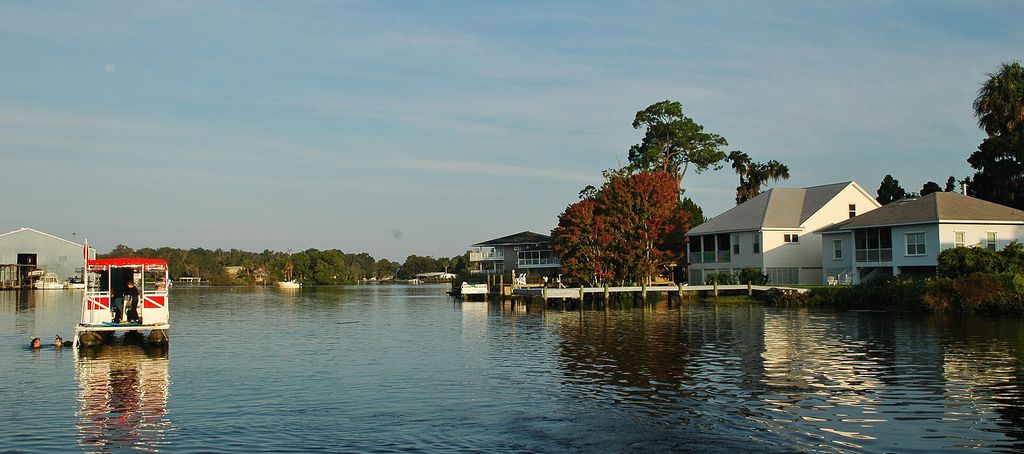
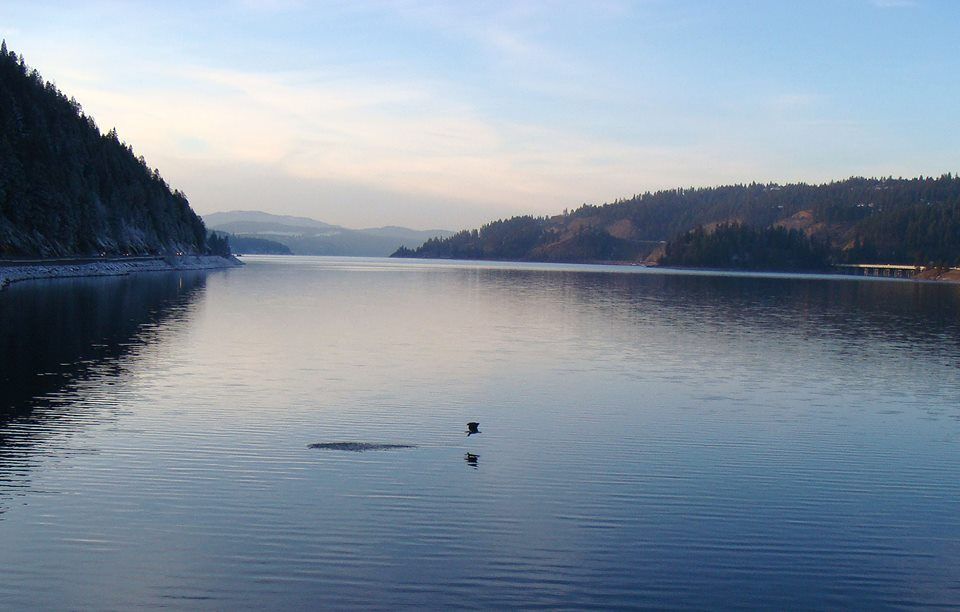
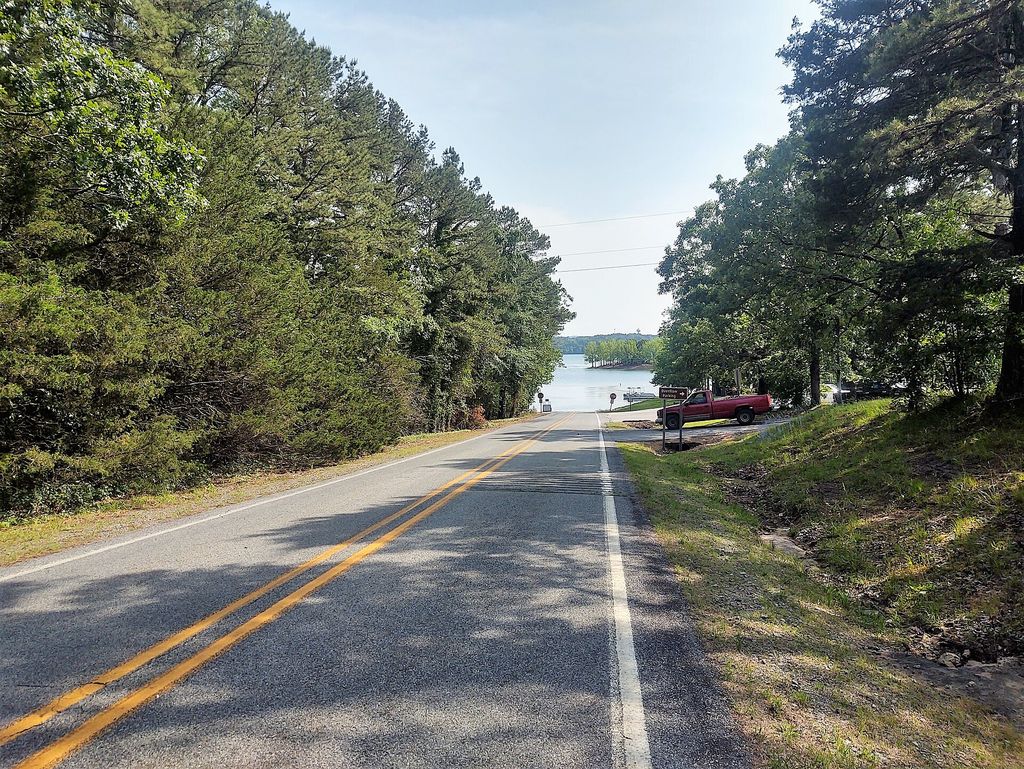
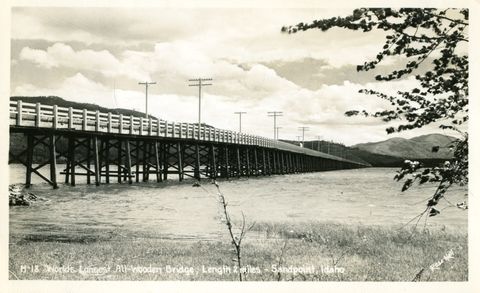
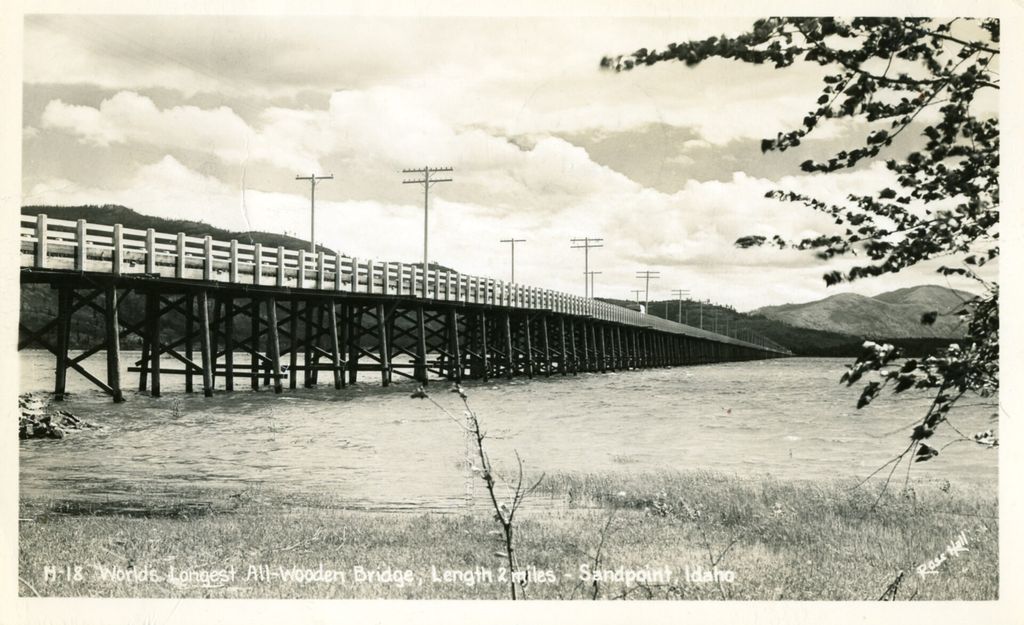
216 photographs of the actual lakes, from Wikimedia Commons.
Photographs via Wikimedia Commons, licensed CC BY / CC BY-SA / public domain. Credit on each lake page.
Water levels and temperature come from U.S. Geological Survey gauges. Water quality from the EPA and state agencies. Reservoir operations from the U.S. Army Corps of Engineers. Every source is public, federal, and free — which is exactly why nobody else has bothered to assemble it.
Circle size is surface area. Color is overall score. Hover for detail, click to open the report.
The number beside each state is how many of its lakes we have surveyed so far.