USLakeFront Lake survey & intelligence
-1 Closer Look at Target Area -9.jpg
Massachusetts Dept. of Environmental… · CC BY 2.0 · Wikimedia Commons
LakesMassachusetts → Quabbin Reservoir

Quabbin Reservoir

Massachusetts · Reservoir impounded 1939 · near Belchertown

24,704 acres 150 ft deep 30 ft clarity Water A
Compare
5.3SCORE
Survey summary · Massachusetts
24,704
Surface acres
150 ft
Max depth
181 mi
Shoreline
30 ft
Typical clarity
530 ft
Elevation

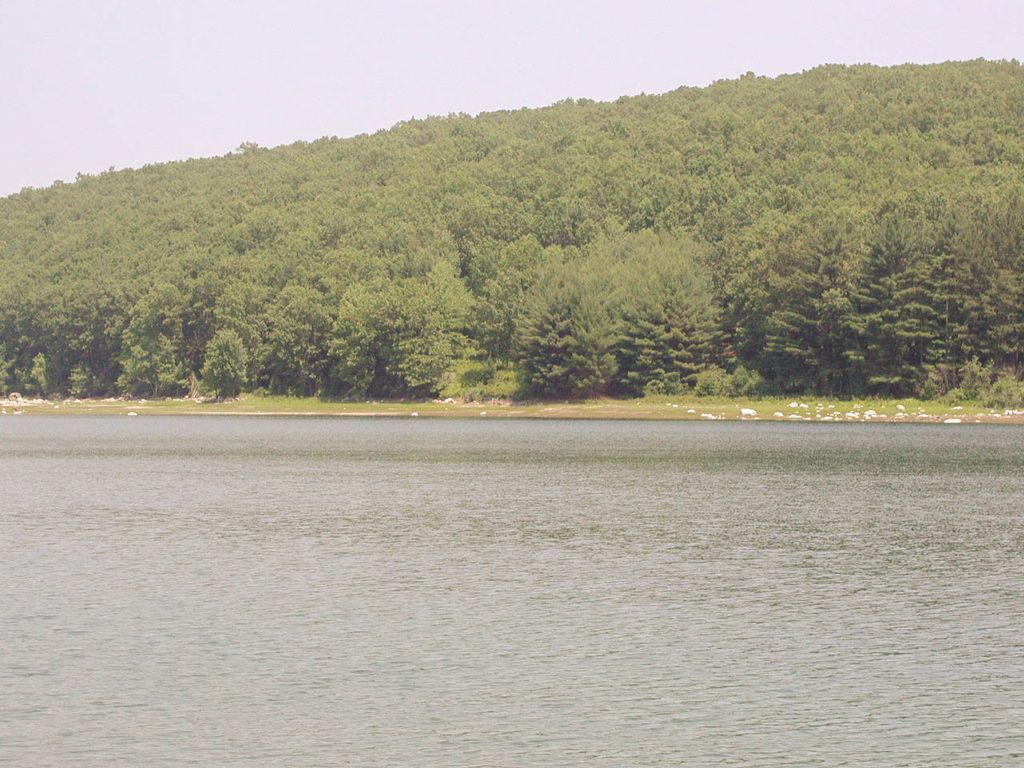
Photographs of Quabbin Reservoir via Wikimedia Commons. Credit and licence on each image — hover to view, click through to the source.

Quabbin Reservoir covers 24,704 acres in Massachusetts and drops to 150 feet at its deepest point. It is a reservoir impounded in 1939 and managed by MA DCR. Water clarity averages around 30 feet, placing it among the clearer bodies of water in the country. Short-term rental posture: Prohibited on watershed. Confirm at the municipal level before underwriting rental income.

What stands out

  • Exceptional clarity, roughly 30 ft
  • Fishing (restricted)
  • Hiking

Watch outs

  • Short-term rental rules are restrictive — do not assume rental income

Score breakdown

WATER RECREATION VALUE ACCESS INVESTMENT
Water 8.7
Recreation 3.8
Value 3.5
Access 7.3
Investment 2.6

Each axis is computed by published formula from this lake's own attributes. How we score.

Water quality grade
Water A
ExcellentClear, low-nutrient water. Typically oligotrophic with high clarity and little seasonal algae.
Water B
GoodHealthy water with moderate clarity. Some seasonal variation, no persistent problems.
Water C
FairProductive water — good fishing, reduced clarity. Algae possible in late summer.
Water D
PoorNutrient-rich or heavily drawn down. Swimmable conditions vary; check before you rely on them.

Computed from measured clarity, trophic state, and drawdown magnitude — not an opinion. See the formula.

Overall score, 1–10
8.0+
ExceptionalStrong on every axis we measure.
7.0–7.9
StrongClearly above average, usually with one standout axis.
6.0–6.9
SolidA good lake with a trade-off worth understanding.
5.0–5.9
MixedReal strengths and real compromises.
Under 5
CompromisedSomething material — volatility, water quality, or access.

Weighted: water 26% · recreation 22% · investment 20% · value 18% · access 14%.

Fishery

Lake troutSmallmouth bassLandlocked salmon

On the water

Fishing (restricted)HikingBirding
No USGS gauge on this lake. Water level and clarity figures below come from published lake management data rather than a live sensor.

What the drawdown looks like

Full pool vs autumn low · Quabbin Reservoir
10 ft FULL POOL AUTUMN LOW

The dock sits at full-pool elevation. At low pool the waterline retreats and the reach to navigable water changes. Scale is illustrative; the 10 ft figure is from published operations for this lake.

Where it is

True shoreline from USGS NHD 97 km²

The outline is this lake's actual boundary from the USGS National Hydrography Dataset, not an approximation — 646 boundary points. Basemap is USGS topographic with contours and hydrography. Switch layers at the top right.

Depth profile

SURFACE 150 ft max avg 48 ft

Idealized cross-section. Max depth 150 ft, average 48 ft. Depth at a specific dock depends on local bathymetry — verify at the property.

Level behaviour

Level stabilityManaged Typical drawdown10 ft Drawdown seasonAutumn Trophic stateOligotrophic Typical clarity30 ft Water quality gradeA Elevation530 ft Managing authorityMA DCR

Dock & shoreline

Permitting authorityMA DCR Wake / speed rulesRowboats only; no private
A dock is never guaranteed. Confirm in writing with MA DCR that the specific parcel is eligible before you remove contingencies.

Short-term rental posture

Prohibited on watershed

Do not underwrite rental income here.
Model rental income →
Modeled estimates. Market figures are derived from lake attributes and regional patterns, not from MLS data. Treat them as a starting point, not a comp.
$875,000
Median waterfront
$7,387
Per shoreline foot
-1.8%
Year over year
13
Est. inventory
67
Avg days on market
$616
Est. nightly rate

Rental snapshot

Modeled occupancy70% Booked nights / yr184 Gross revenue$123,955 Net operating income$61,862 Yield on median price7.07%
Open the full model →

What a median-priced home on Quabbin Reservoir actually costs to carry, with waterfront-specific line items most calculators omit.

$7,046
All-in per month
$199,250
Cash to close + setup
$16,365
Beyond P&I, tax, insurance
Where the annual cost goes
$84,550 PER YEAR
Principal & interest $55,322 (67%) Maintenance reserve (1.1%) $9,625 (12%) Property taxes $9,188 (11%) Hazard insurance $3,675 (4%) Utilities $2,700 (3%) Shoreline / seawall reserve $960 (1%) Dock maintenance $900 (1%) Winterization / seasonal close $750 (1%)

Annual carry

Principal & interest$55,322
Property taxes$9,188
Hazard insurance$3,675
Flood insurance$650
Utilities$2,700
Maintenance reserve (1.1%)$9,625
Septic service$520
Well & water testing$260
Dock maintenance$900
Winterization / seasonal close$750
Shoreline / seawall reserve$960
Total$84,550
Model your own numbers →

No reviews yet

Be the first to write about Quabbin Reservoir.

For sale

Homes on Quabbin Reservoir

All listings →