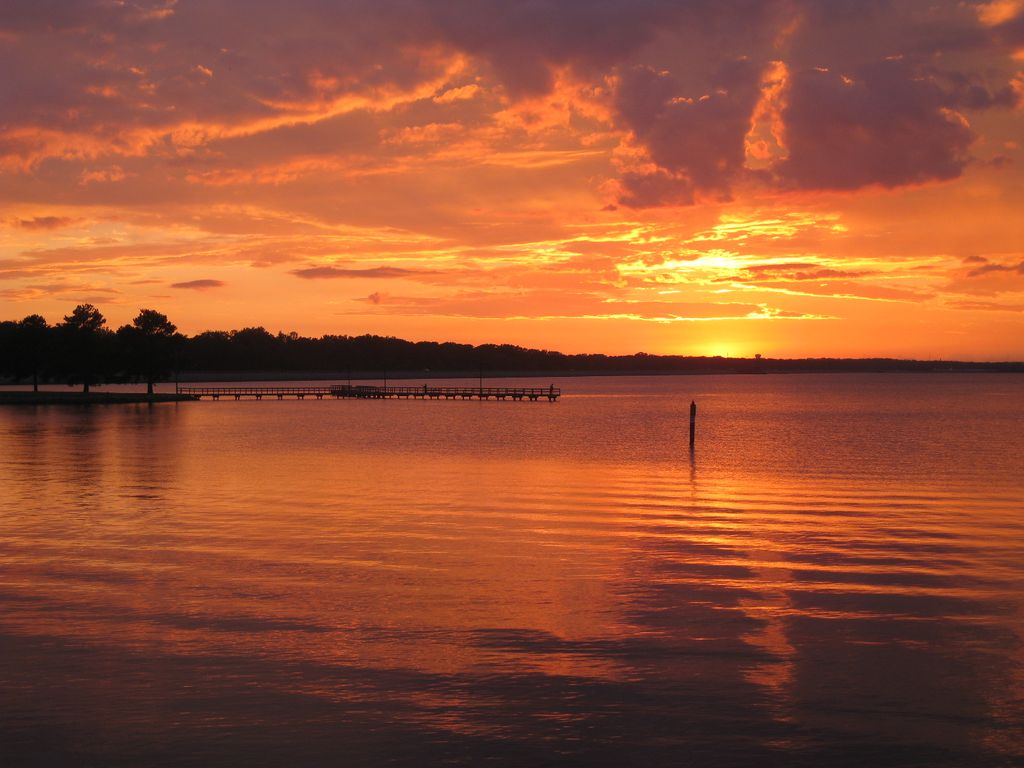
Ross Barnett Reservoir covers 33,000 acres in Mississippi and drops to 40 feet at its deepest point. It is a reservoir impounded in 1963 and managed by Pearl River Valley WSD. Level is unusually stable, which protects dock usability and shoreline appearance year round. Clarity is limited, which is typical of productive fisheries but worth seeing in person if you are swimming daily. Short-term rental posture: District leasehold rules. Confirm at the municipal level before underwriting rental income.
What stands out
Very stable water level year-round
Fishing
Boating
Watch outs
Nutrient-rich water; seasonal algae blooms are possible
Short-term rental rules are restrictive — do not assume rental income
Score breakdown
Water4.0
Recreation6.3
Value7.0
Access7.3
Investment5.5
Each axis is computed by published formula from this lake's own
attributes. How we score.
Water quality grade
Water A
ExcellentClear, low-nutrient water. Typically oligotrophic with high clarity and little seasonal algae.
Water B
GoodHealthy water with moderate clarity. Some seasonal variation, no persistent problems.
Water C
FairProductive water — good fishing, reduced clarity. Algae possible in late summer.
Water D
PoorNutrient-rich or heavily drawn down. Swimmable conditions vary; check before you rely on them.
Computed from measured clarity, trophic state, and drawdown magnitude —
not an opinion. See the formula.
Overall score, 1–10
8.0+
ExceptionalStrong on every axis we measure.
7.0–7.9
StrongClearly above average, usually with one standout axis.
6.0–6.9
SolidA good lake with a trade-off worth understanding.
5.0–5.9
MixedReal strengths and real compromises.
Under 5
CompromisedSomething material — volatility, water quality, or access.
Weighted: water 26% · recreation 22% · investment 20% · value 18% · access 14%.
Fishery
Largemouth bassCrappieCatfishBream
On the water
FishingBoatingSailing
Live from ROSS BARNETT RESERVOIR NR JACKSON, MS.
This is a lake or reservoir station measuring
gage height on this water body — direct sensor
readings, not estimates.
296.76 ft
Gage height
2026-10-02
Gauge history
Daily values from USGS. Loading up to one year.
Where it is
Location
No NHD boundary matched this water body, so the marker shows the mapped centre point.
Depth profile
Idealized cross-section. Max depth 40 ft,
average 13 ft. Depth at a specific dock depends on local bathymetry —
verify at the property.
Level behaviour
Level stabilityStableTypical drawdown3 ftDrawdown seasonWinterTrophic stateEutrophicTypical clarity4 ftWater quality gradeDElevation297 ftManaging authorityPearl River Valley WSD
Dock & shoreline
Permitting authorityPearl River Valley WSDWake / speed rulesNo-wake in coves
A dock is never guaranteed. Confirm in writing with
Pearl River Valley WSD that the specific parcel is eligible before you remove contingencies.
Short-term rental posture
District leasehold rules
Restrictions apply and vary by jurisdiction. Verify at the municipal level before you offer.
Modeled estimates. Market figures are derived from
lake attributes and regional patterns, not from MLS data. Treat them as a starting point, not a comp.
$560,000
Median waterfront
$904
Per shoreline foot
-0.4%
Year over year
65
Est. inventory
156
Avg days on market
$447
Est. nightly rate
Rental snapshot
Modeled occupancy41%Booked nights / yr108Gross revenue$54,393Net operating income$25,818Yield on median price4.61%